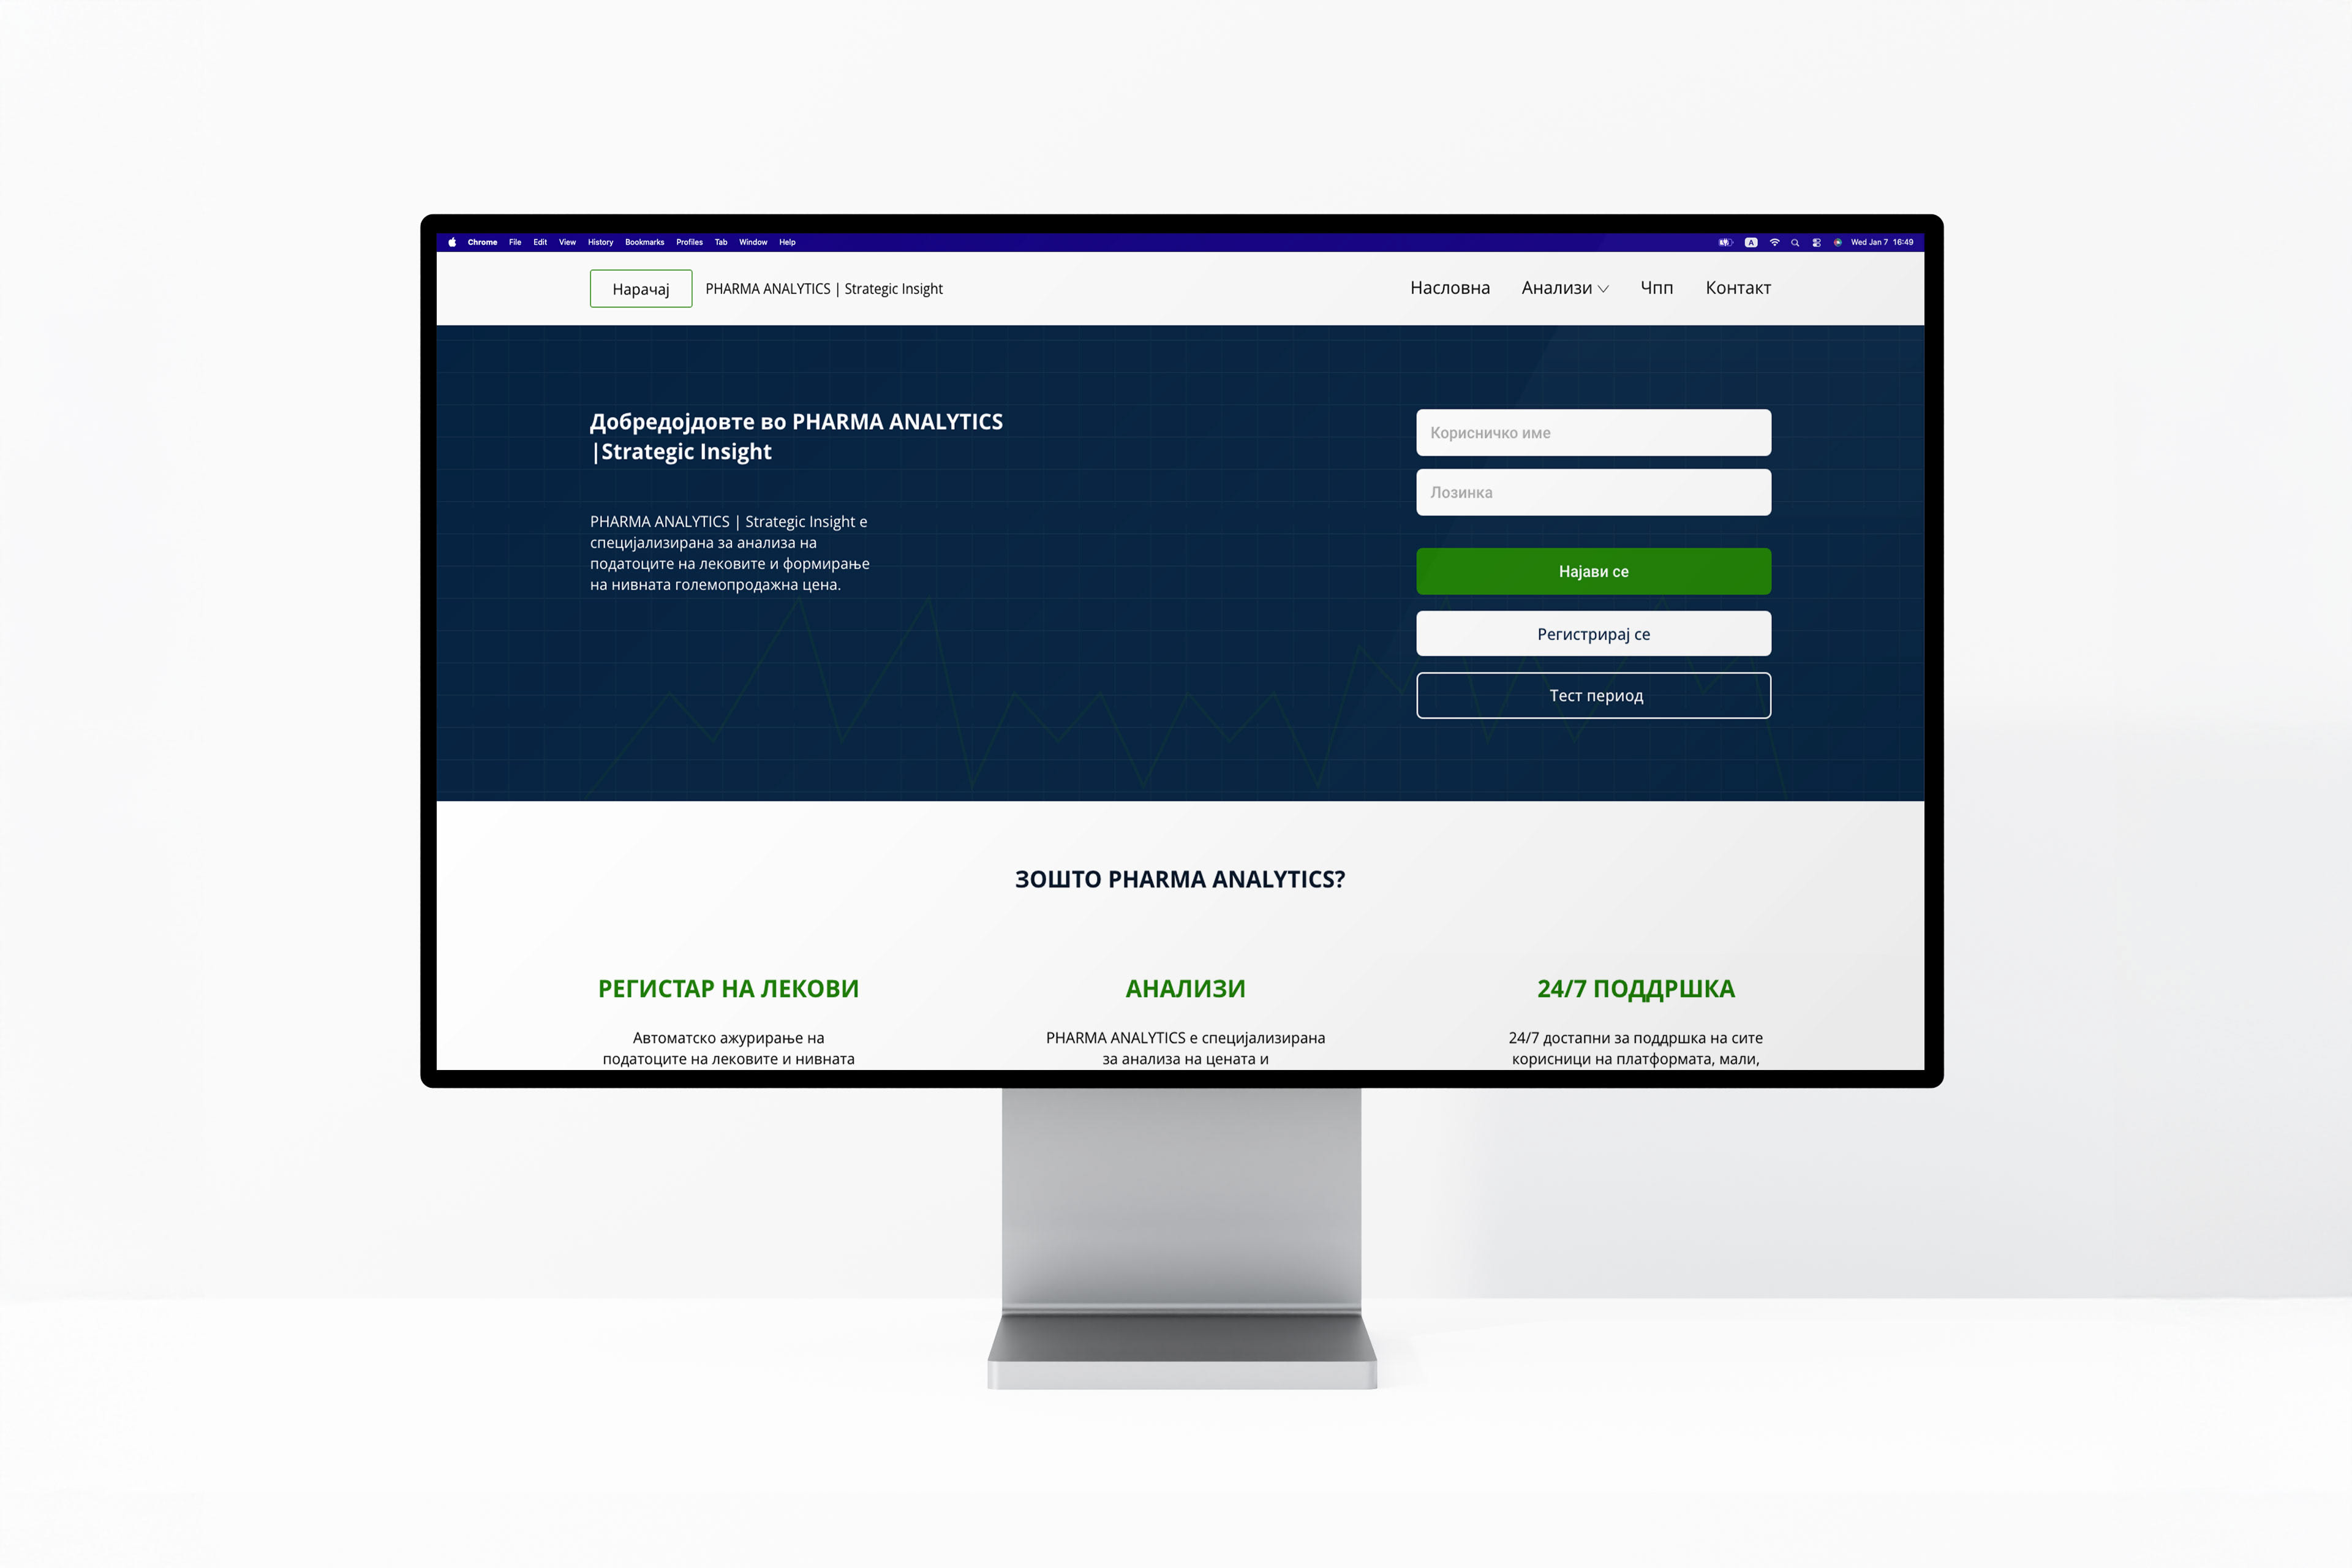
Pharma Analytics
Pharma Analytics is a web application designed to automate the calculation and formation of wholesale drug prices in North Macedonia. Its primary goal is to replace manual copy-paste workflows in Excel spreadsheets with a streamlined digital process, enabling faster task completion, reduced human error, and optimized operational efficiency with fewer required staff.
About Project
Pain Point
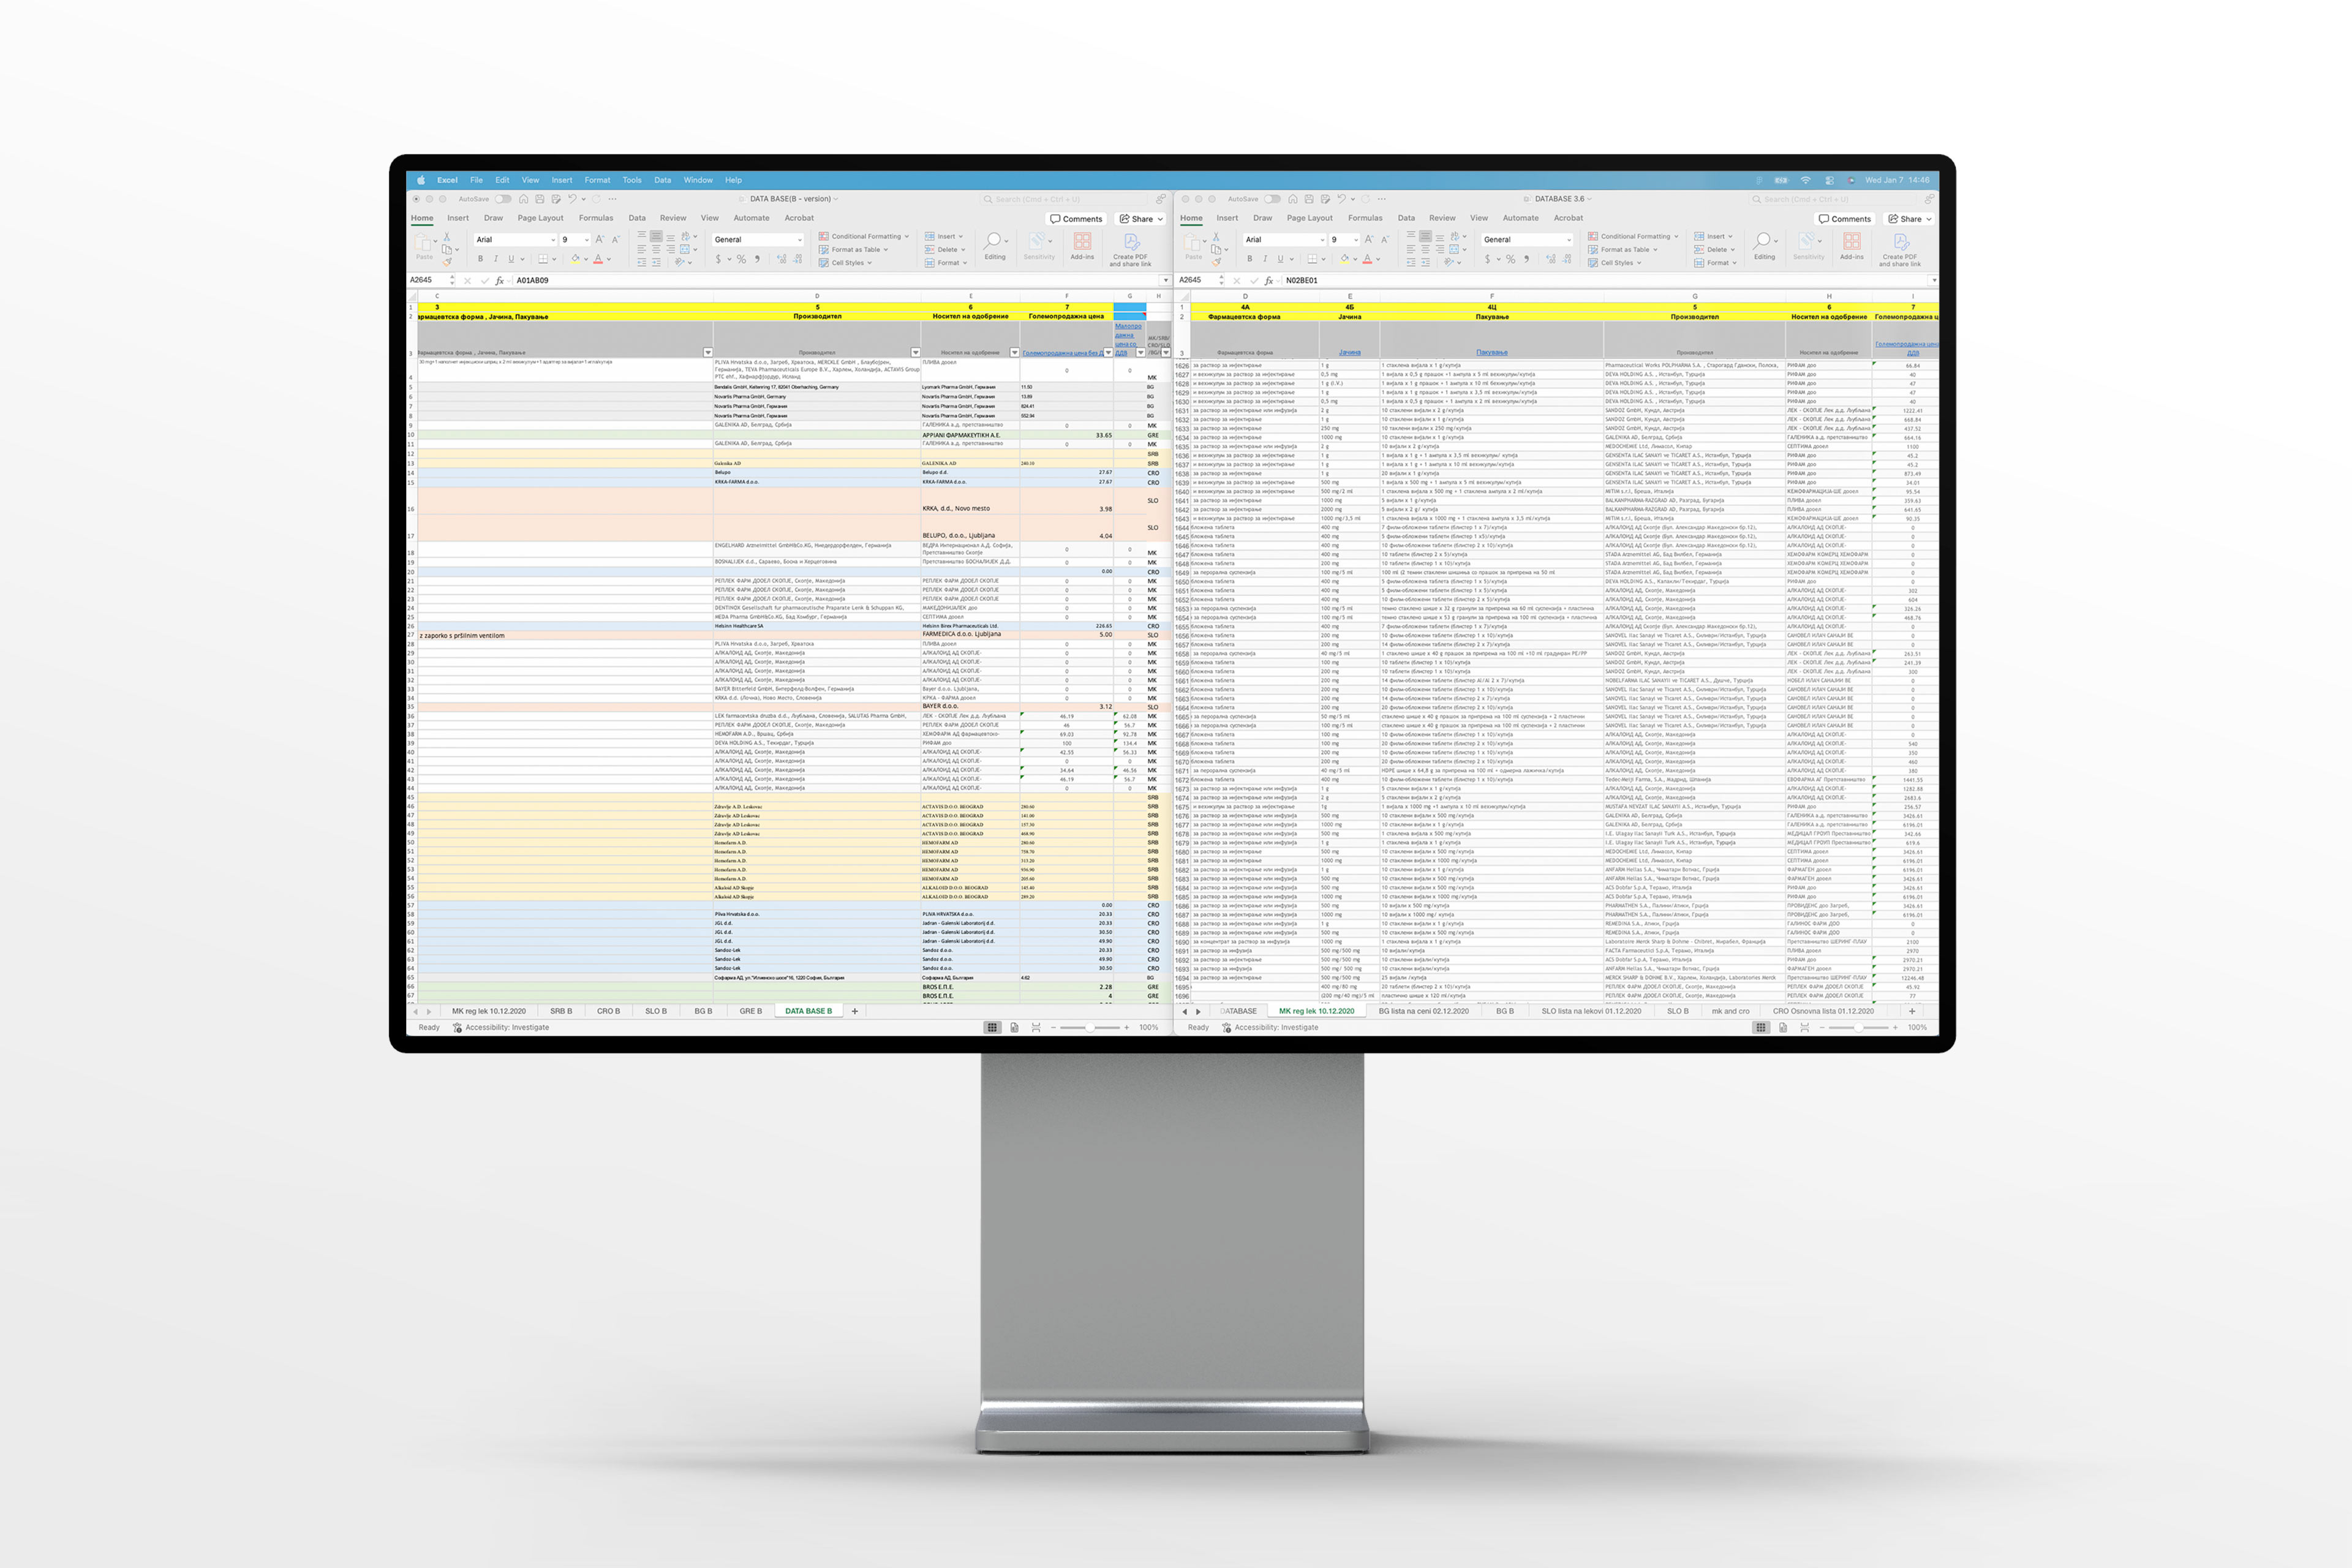
According to the Methodology of the Ministry of Health, the reference prices in the Republic of North Macedonia are determined as the average of the lowest prices from the countries Slovenia, Croatia, Serbia, Greece, and Bulgaria. Data that are constantly changing are difficult to compare due to their structure, language, presentation, and often unsynchronized lists. There is no data on drug consumption!
Each medicine has a unique ATC code, which is shared across different dosages of the same drug. In practice, this means that Vitamin C 500 mg and Vitamin C 1000 mg have the same ATC code, but represent different products with different prices. The biggest challenge was finding a reliable way to distinguish between these medicines.
Current solution
Manual calculation of prices when determining the lists by all stakeholders (large number of working hours, employment of special pricing experts, errors, delays, non-synchronization, localization of calculations.
Our Solution
The first step was to analyze Excel spreadsheets received from various countries. During this analysis, it became clear that each country used a different way of writing dosage information, and one of the datasets did not contain ATC codes at all.
To perform accurate comparisons, having the ATC code present in all datasets was crucial. To achieve this, we first automated the Excel VLOOKUP process using Python. By leveraging the generic name of the medicine, the script automatically populated missing ATC codes across all tables.
Once all datasets were complete, the next challenge was teaching the system how to recognize differently formatted dosage values across countries. Some datasets used symbols such as “&”, others used “|”, even though they represented the same meaning. The system was trained to understand that these variations referred to equivalent dosage structures.
AI was integrated as a decision-support layer, assisting in data normalization and pattern recognition, while final pricing logic remained fully deterministic and regulation-driven.
Data collection, their calculations, and the visual presentation of the data related to the Drugs
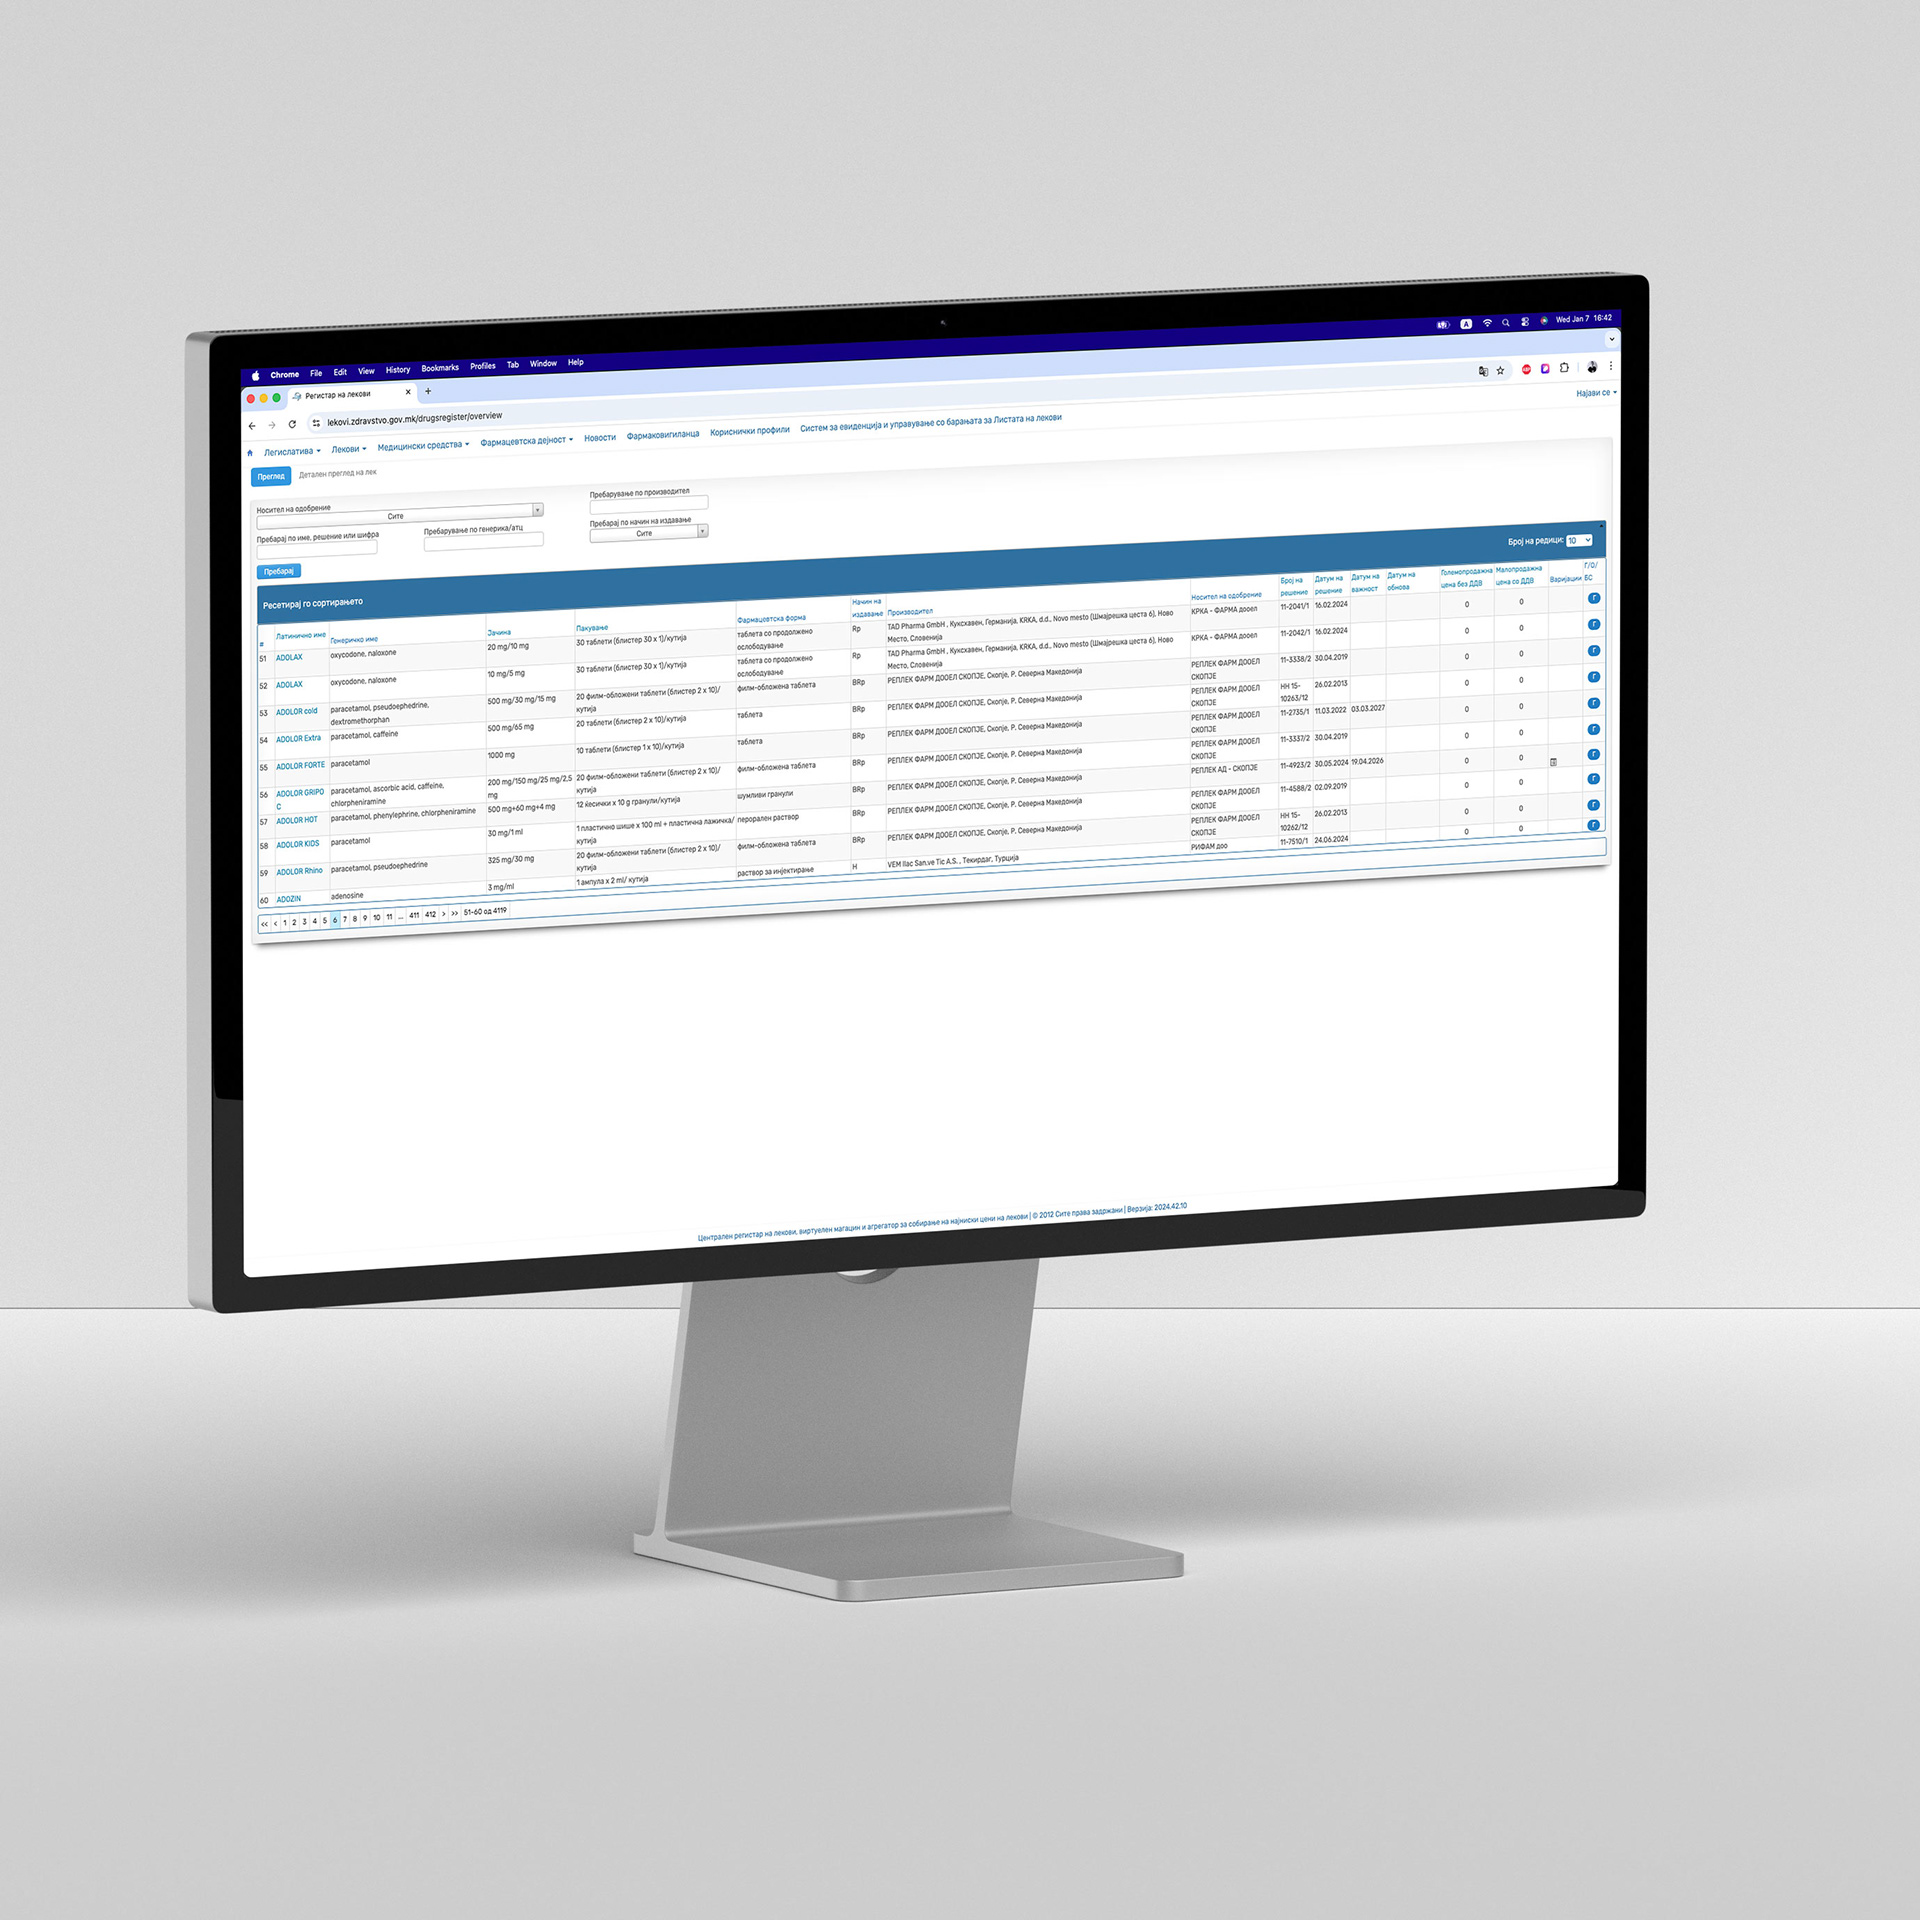
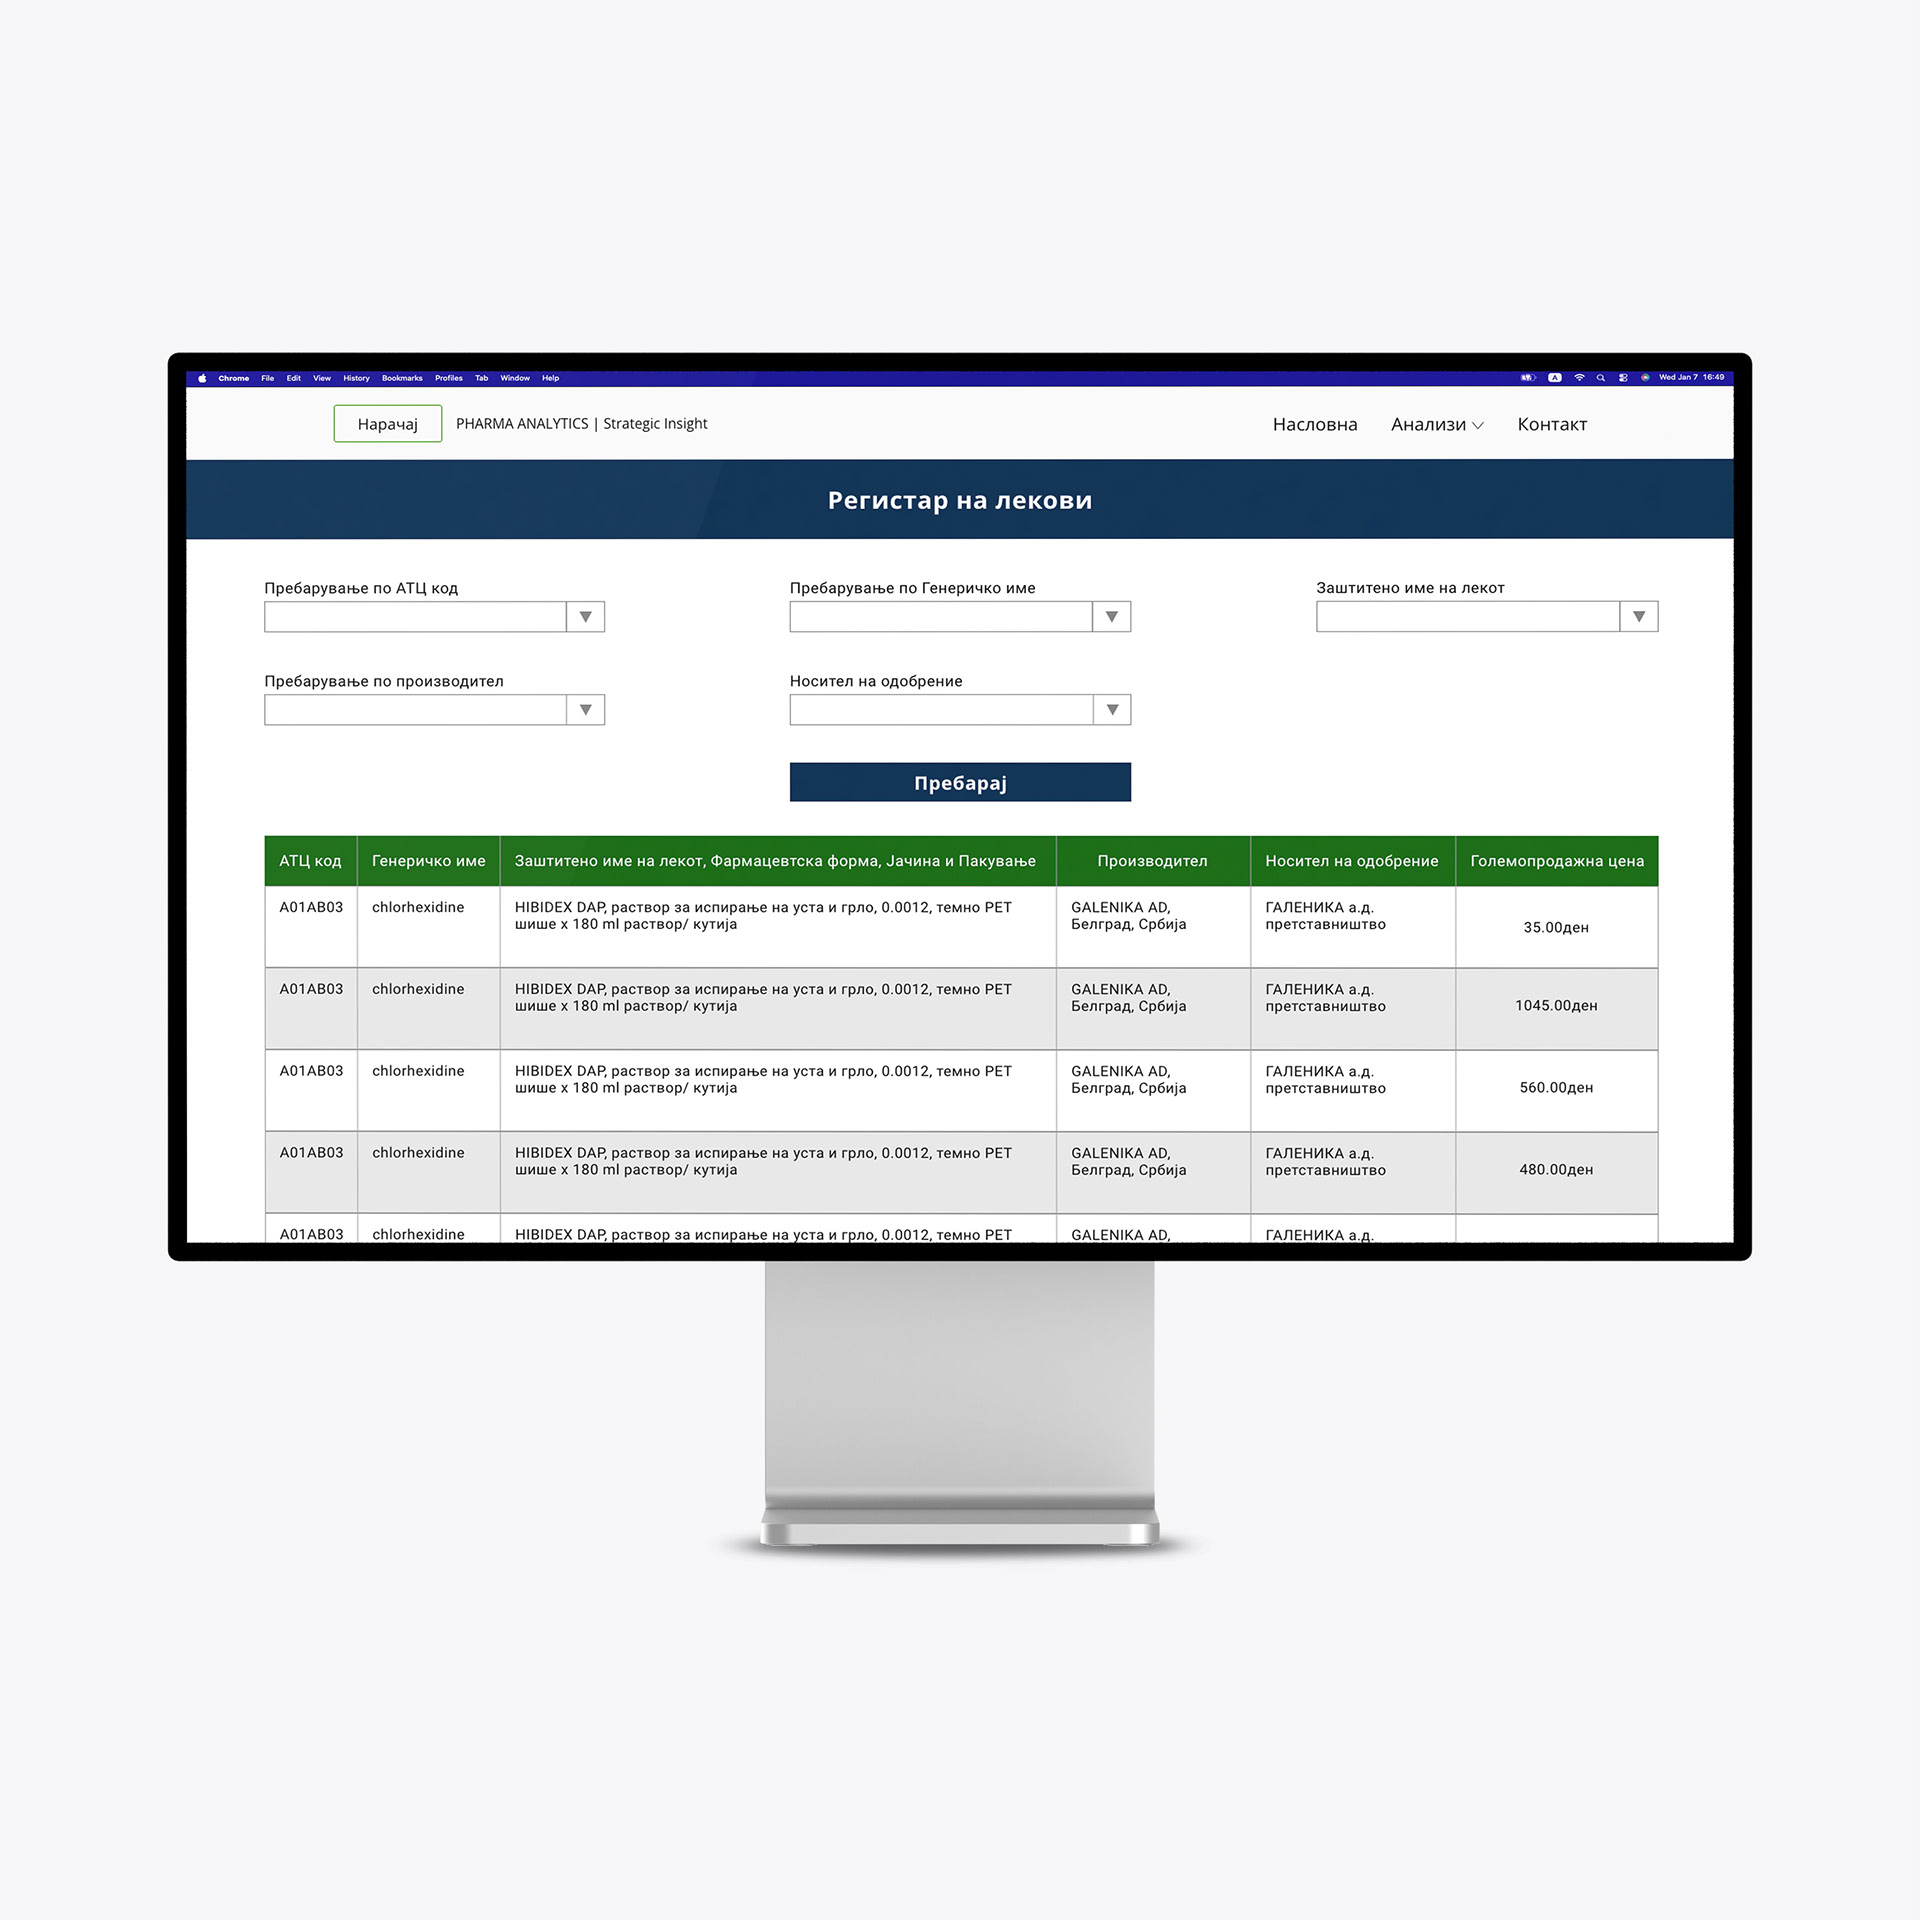
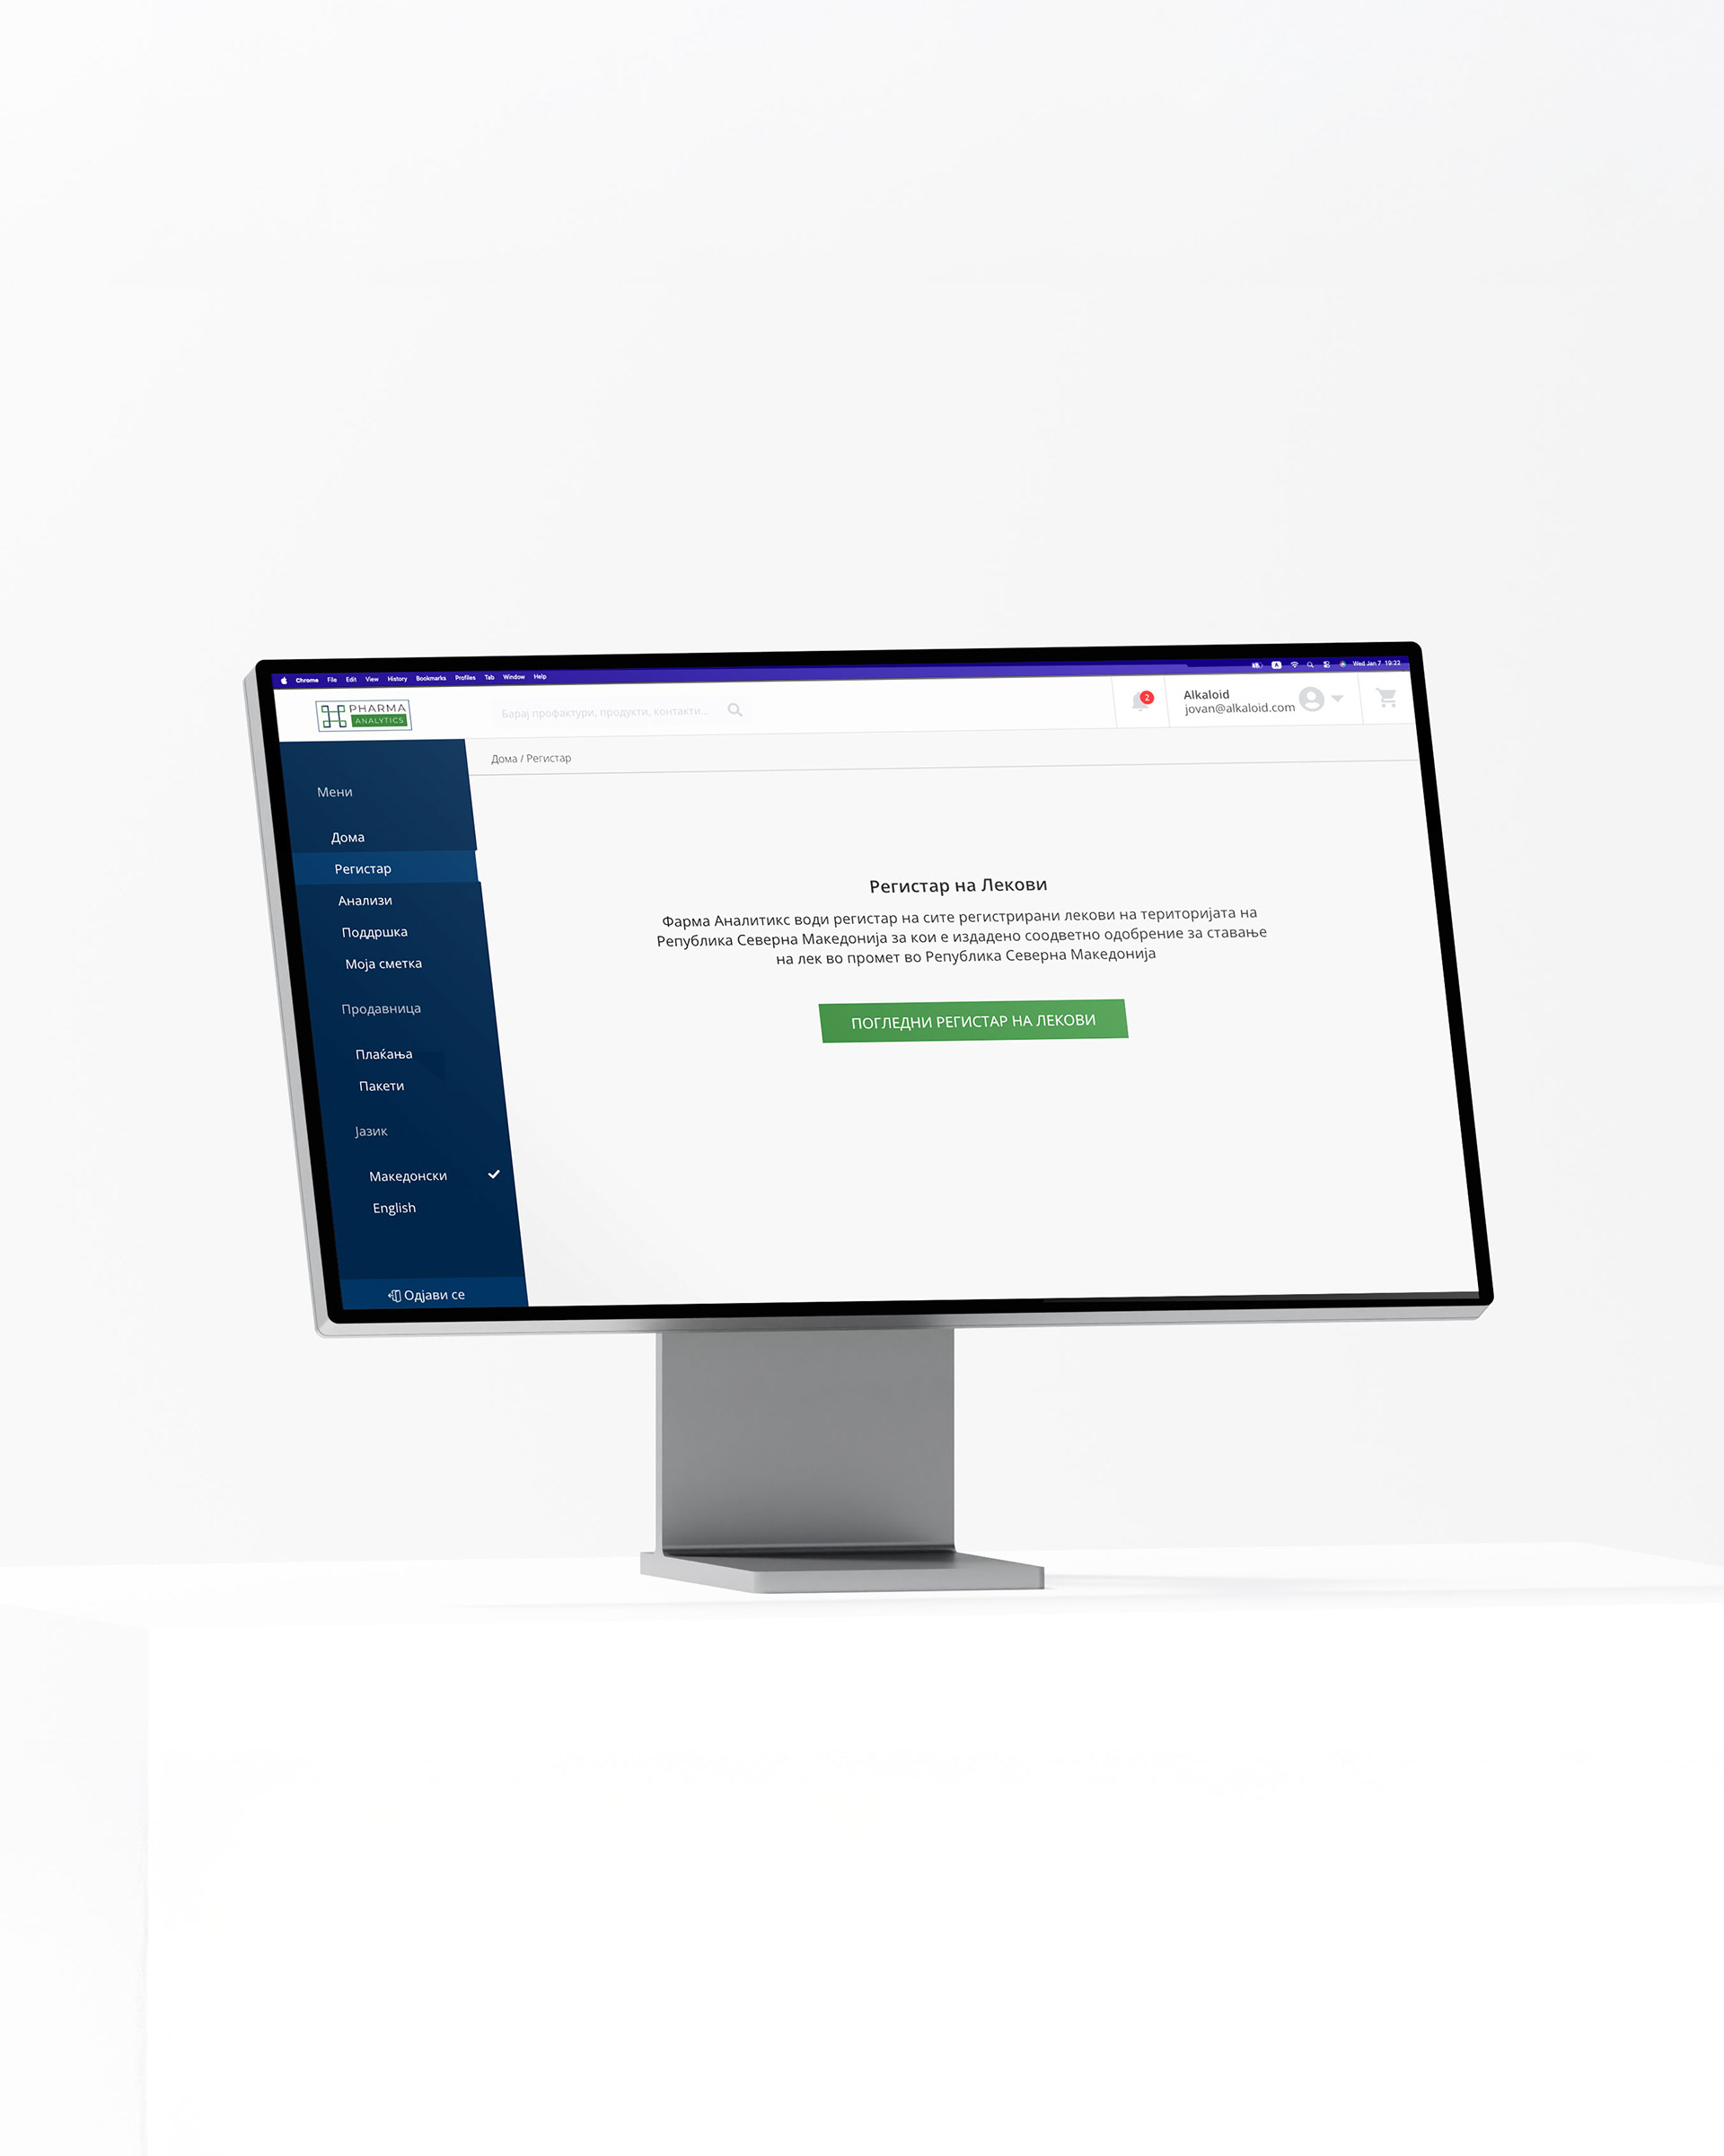
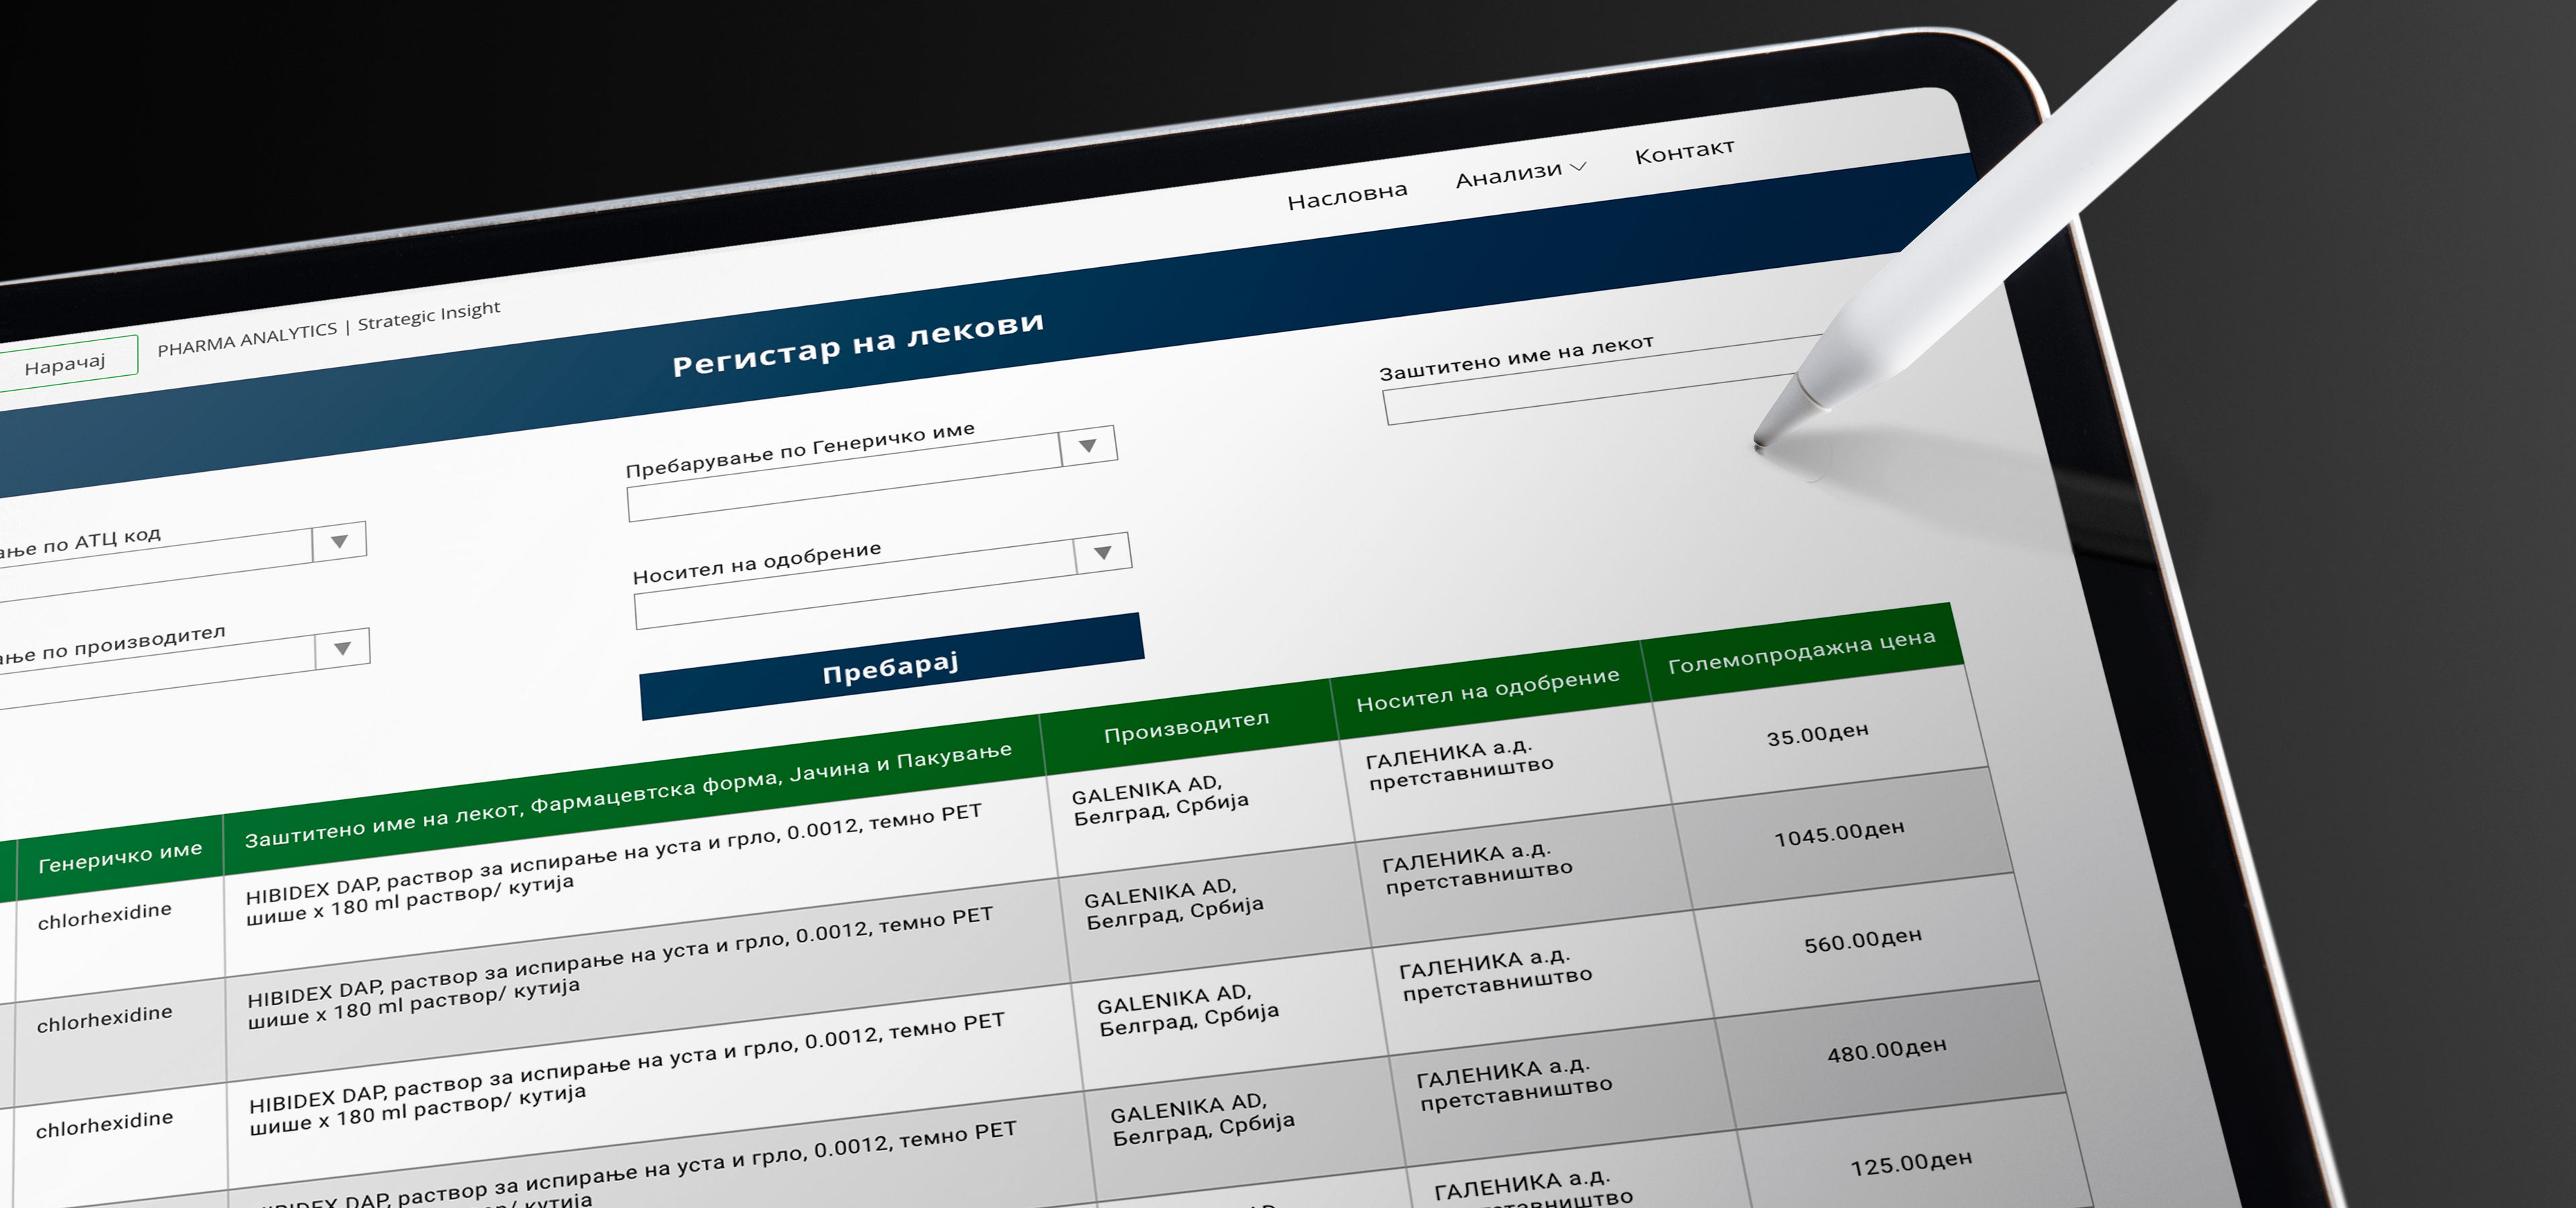
The old platform displayed only a basic list of medicines without pricing information, using small, non-intuitive tables that relied heavily on manual Excel work. The new platform transforms this process by automatically calculating and displaying prices in clear, readable tables with an intuitive workflow. This significantly reduces manual effort, minimizes errors, and speeds up decision-making.